Argentina elects the Chamber of Deputies (Cámara de Diputados) off of closed party lists via the d’Hondt highest average method of proportional representation with provinces and the capital district serving as constituencies. See the Paraguay page for an example of how the d’Hondt method operates in practice. Parties must win 3% of the vote in a constituency to qualify to receive seats.
Unusually for lower houses, elections to the Chamber are staggered with roughly 50% of the deputies elected every two years since the initial election of the entire Chamber at once in 1983 with the return to democracy.
The number of deputies elected from each provincial or the capital district constituency have remained the same since 1983. Put another way, each constituency elected the same number of deputies in 1985, 1989, 1993, and so on. Each constituency also elected the same number of deputies in 1987, 1991, 1994, and so on.
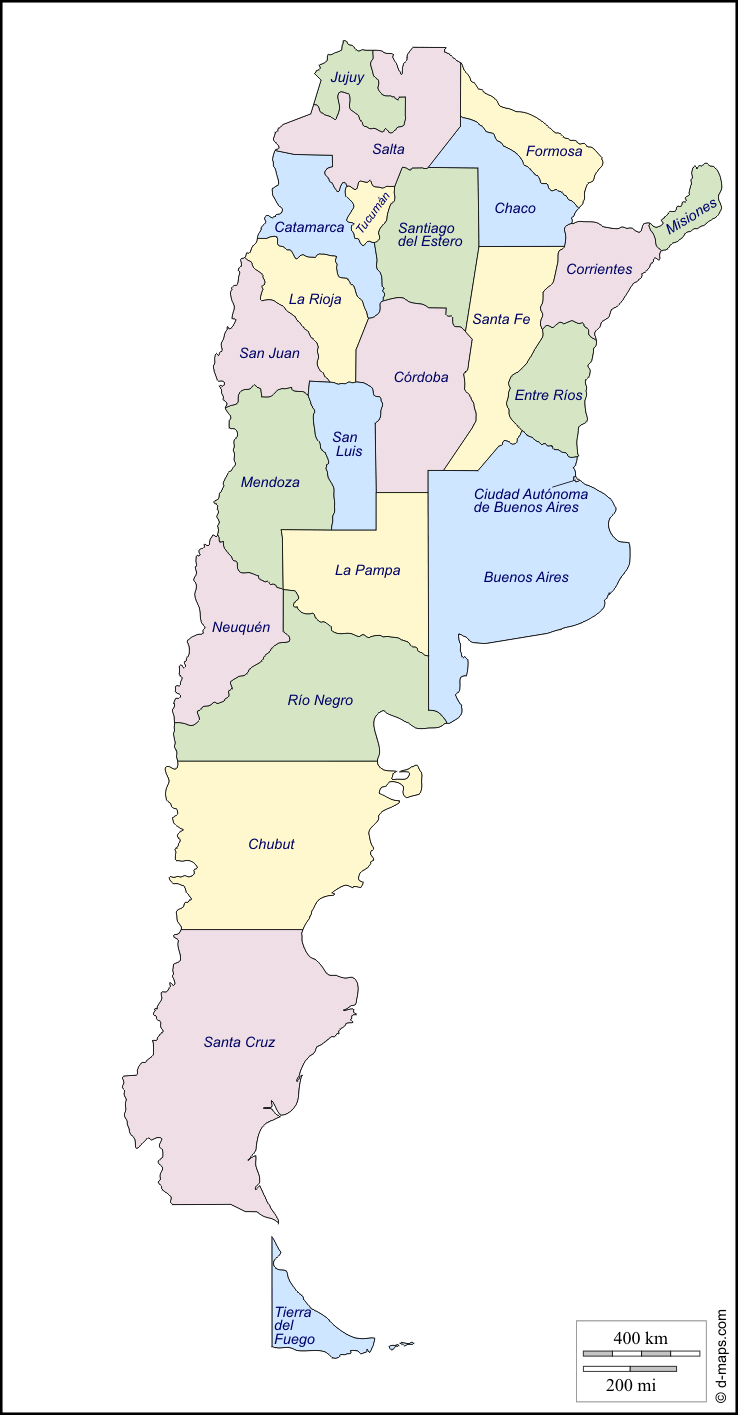
A map of Argentina’s provinces follows this table.
| APPORTIONMENT OF SEATS TO PROVINCES |
|||
| PROVINCE | 1983 | 1985 | 1987 |
| and every four years after | |||
| Buenos Aires | 70 | 35 | 35 |
| Capital Federal | 25 | 13 | 12 |
| Catamarca | 5 | 3 | 2 |
| Chaco | 7 | 4 | 3 |
| Chubut | 5 | 2 | 3 |
| Córdoba | 18 | 9 | 9 |
| Corrientes | 7 | 3 | 4 |
| Entre Ríos | 9 | 5 | 4 |
| Formosa | 5 | 2 | 3 |
| Jujuy | 6 | 3 | 3 |
| La Pampa | 5 | 3 | 2 |
| La Rioja | 5 | 2 | 3 |
| Mendoza | 10 | 5 | 5 |
| Misiones | 7 | 3 | 4 |
| Neuquén | 5 | 3 | 2 |
| Río Negro | 5 | 2 | 3 |
| Salta | 7 | 3 | 4 |
| San Juan | 6 | 3 | 3 |
| San Luis | 5 | 3 | 2 |
| Santa Cruz | 5 | 3 | 2 |
| Santa Fe | 19 | 9 | 10 |
| Santiago del Estero | 7 | 3 | 4 |
| Tierra del Fuego | 5 | 2 | 3 |
| Tucumán | 9 | 4 | 5 |
| ARGENTINA | 257 | 127 | 130 |
Provinces and Capital District of Argentina
 Sources: Atlas Electoral de Andy Tow. Matthew M. Singer and Carlos Fara, “The presidential and legislative elections in Argentina, October 2007,” Electoral Studies 27(2008), 756.
