Bolivia has used five electoral systems to elect the Chamber of Deputies (Cámara de Diputados) since 1979. The number of seats was fixed at 130 starting in 1980. Results have been linked consistently to votes cast in the presidential election.
Bolivia 1 (1979-85)
Voters cast a single ballot for a presidential candidate that also served to allocate seats in the Chamber to party (or coalition) lists associated with the candidates. During the three elections that this electoral system was utilized—1979, 1980, and 1985–seats were allocated within departments using the largest remainder system of proportional representation with a Hare quota. Lists were closed, so seats were distributed in the order of the list.
The following table shows the allocation process for the Department of Chuquisaca in 1979:
 The Hare quota equaled 89,666 valid votes divided by 12 seats, or 7472. The third column shows the result of dividing the votes for each party by the Hare quota. Parties then receive seats for full multiples of the quotas (i.e. the portion of the Hare quota to the left of the decimal point). The fifth column shows the remainder votes, or votes not used towards a full Hare quota. The remaining 3 seats were allocated in descending order of remainder votes. The final column displays the total seats won by each party. As seats were closed, the appropriate number of candidates were elected in order off of each winning party’s list.
Bolivia 2 (1989)
Bolivia continued to allocate seats in the Chamber to parties based on the presidential vote off of closed lists within departments. However, the “double quotient” method was used to allocate seats.
First, a Hare quota–valid votes for all parties divided by the number of seats in the department–was calculated based on all votes. Only parties that won more than a Hare quota qualified to participate in the next allocation stage.
A second Hare quota was calculated based on the valid votes cast for qualified parties (i.e. the sum of votes cast for qualified parties divided by the number of seats in the department). Parties then immediately received seats for as many complete multiples of this second Hare quota as they had won with any votes not used towards full quotas classified as remainder votes.
If all seats had not yet been distributed, the allocation process continued in a third stage. In this stage, parties that had not qualified to receive seats could still receive 1 mandate if they won more votes than the sum of remainder votes for all parties that had qualified to receive seats. At this point, any seats left were distributed in descending order of the largest remainder of votes held by qualified parties until all seats were exhausted.
The following table shows the allocation of seats in 1989 in Chuquisaca Department:
 The first Hare quota, 5826, equaled votes cast for all parties (75,744) divided by the 13 seats. The third column displays how many multiples of this quota were won by each party. Only four parties–ADN, PS1, MIR and IU–won at least 1 full quota and qualified to receive seats in the next stage. A second Hare quota, 5298, was calculated by dividing the number of votes received by these four parties (68,876) by the 13 seats. The fifth column shows how many multiples of this second Hare quota were won by each party. As shown in the sixth column, 11 seats were awarded for full Hare quotas.
Two seats remained to be distributed. The four qualifying parties had a total of 10,596 remainder votes. As none of the non-qualifying parties gained this many votes, the two last seats went to qualifying parties in descending order of remainder votes. The final column shows the total number of seats received by each party. Lists were closed so the appropriate number of candidates were elected in order off of the party lists.
Bolivia 3 (1993)
The presidential vote continued to be used to allocate votes to associated party lists off of closed lists within departments. However, the allocation formula shifted again. In 1993, Bolivia allocated mandates within each departmental constituency by the Sainte-Laguë method of proportional representation.
For Sainte-Laguë, each party receives a quotient equal to the number of votes won divided by twice the number of seats already gained plus 1 (i.e. the sequence of odd numbers: 1, 3, 5, . . . served as the divisors). Each time a party gained a seat, the quotient was recalculated.
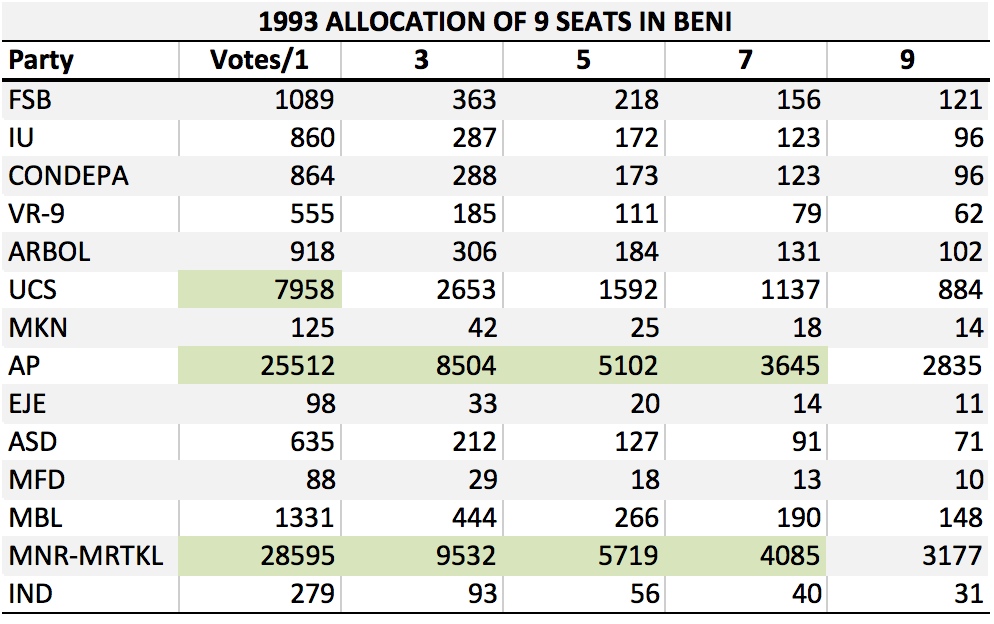
The following table demonstrates how the Department of Beni’s 9 seats were allocated in 1993. The second column shows the number of votes received by each party, which is equal to the first quotient–votes divided by 1. MNR-MRTKL gains the first seat for the highest quotient and has its quotient recalculated to its votes divided by 3 (i.e. the next odd number or twice the number of seats won plus 1). At this point, AP has the highest quotient and gained the second seat. After that, MNR-MRTKL once again had the highest quotient and gained the third seat. The process continued until all 9 seats were distributed.
 Bolivia 4 (1997-2005)
This mixed-member proportional system was used in the 1997, 2002 and 2005 elections. Bolivia 4 was identical to Bolivia 5 (described below) except that there were no reserved indigenous seats.
Bolivia 5 (2009-)
Bolivia uses a mixed-member proportional system to elect the 130 members of the Chamber. There are three types of seats: (1) party list, (2) single-member district (SMD), and (3) reserved indigenous seats. Each department has a set number of seats that includes a mixture of party list and SMD seats. Most departments also have one indigenous seat.
Method of Allocating Seats to Parties
Voters cast two votes. One is for a vote for a party list, which is tied to the presidential vote. Put another way, when voters cast their presidential vote, they are also casting a vote for the list of candidates from the same party as the presidential candidate. Based on the presidential/party-list vote, all seats, including SMD and indigenous seats, are initially allocated within departments to parties utilizing the d’Hondt highest average method of proportional representation. Parties must win at least 3% of the list votes nationally in order to qualify to receive list seats.
Voters also cast a vote for a deputy in a SMD or a reserved indigenous seat. The candidate with the most votes in the SMD or indigenous seats wins election. There are a total of 7 indigenous seats with no department having more than 1; the number of SMDs and list seats has varied.
The allocation of party-list seats within each department is determined by subtracting the number of SMD or indigenous seats won from the total number of seats a party merits according to the initial d’Hondt allocation. Lists are closed, so seats go to candidates based on the order in which they appear on the party list.
There are no overhang seats. In other words, if a party wins more SMD and indigenous seats than it deserves according to the d’Hondt allocation, it keeps the SMD and indigenous seats. The number of party-list seats is then reduced to the detriment of other parties with the lowest d’Hondt quotas. The last seats allocated by the d’Hondt method are taken away from other parties so that the total number of seats remains unchanged.
Examples of Allocation to Parties
The following table shows the allocation process in the Department of Beni in 2009. Beni had 5 SMDs, numbered 61 through 65, and 1 indigenous constituency along with 3 list seats for a total of 9 seats. The top part of the table shows the results in the SMDs and indigenous constituency by party. The winning party in each constituency is highlighted in green with the total seats won tallied below the votes.  The bottom portion of the table reveals the process for allocating list seats. Only 3 parties, MAS, PPB and UN-CP, won more than 3% of the national vote and were eligible to receive list seats. The series of d’Hondt quotas–list votes divided by 1, 2, 3, and so on–for these three parties are shown along with the presidential/party-list votes won by all parties. The divisor used to calculate each d’Hondt quota is shown in the first column (except for the first row as the first quota is equal to the number of votes).
The 9 highest quotas are highlighted in green, and indicate that the overall distribution of seats in Beni should have been 5 seats for the PPB and 4 seats for MAS. As PPB already won 4 SMDs, it was entitled to 1 list seat to bring it up to the total of 5 seats. Similarly, MAS won 1 SMD and the indigenous constituency, so it is received 2 list seats to meet its total of 4 seats. As lists are closed, the first candidate on the PPB list, and the top two candidates on the MAS list were elected. The final total of seats received by each party equaled that indicated by the d’Hondt allocation.
The following table shows the 2009 allocation in the Department of Tarija–a case that demonstrates how Bolivia addresses the problem of overhang seats. Tarija had a total 5 SMDs, numbered 45 through 49, and an indigenous district, as well as 3 list seats. Once again, the top part of the table shows the results in the SMDs and indigenous district by party. The winning party in each district is highlighted in green with the total seats won tallied below the votes. AS won 1 seat to 2 for PPB and 3 for MAS.
 The bottom portion of the table shows the process for allocating list seats. Only 3 parties, MAS, PPB and UN-CP, won more than 3% of the national vote and were eligible to receive list seats. The series of d’Hondt quotas for these three parties are shown along with the list votes won by all parties.
The 9 highest quotas are highlighted in green or pink, and indicate that the overall distribution of seats in Tarija should be 5 seats for the MAS and 4 seats for PPB. However, though AS was not eligible for list seats, it won 1 SMD in Tarija. AS got to keep this overhang seat and the number of list seats declined by 1. PPB lost its last list because it would have been the seat gained with the lowest d’Hondt quota–highlighted in pink. The revised total entitlement for the two parties over the 3% threshold is shown in the row below the original d’Hondt allocation.
MAS gained 2 list seats to bring it up to its entitled total of 5 seats, as it already won 2 SMDs and the indigenous seat. PPB received just 1 list seat on top of its 2 SMD seats for a total of 3 seats. AS held the only remaining seat in Tarija.
Apportionment
The following table shows the apportionment of seats to departments, which served as multimember electoral constituencies, from 1979 through 1993:
 The following table displays the apportionment of SMD, indigenous, and party-list seats by department under the MMP system utilized since 1997:
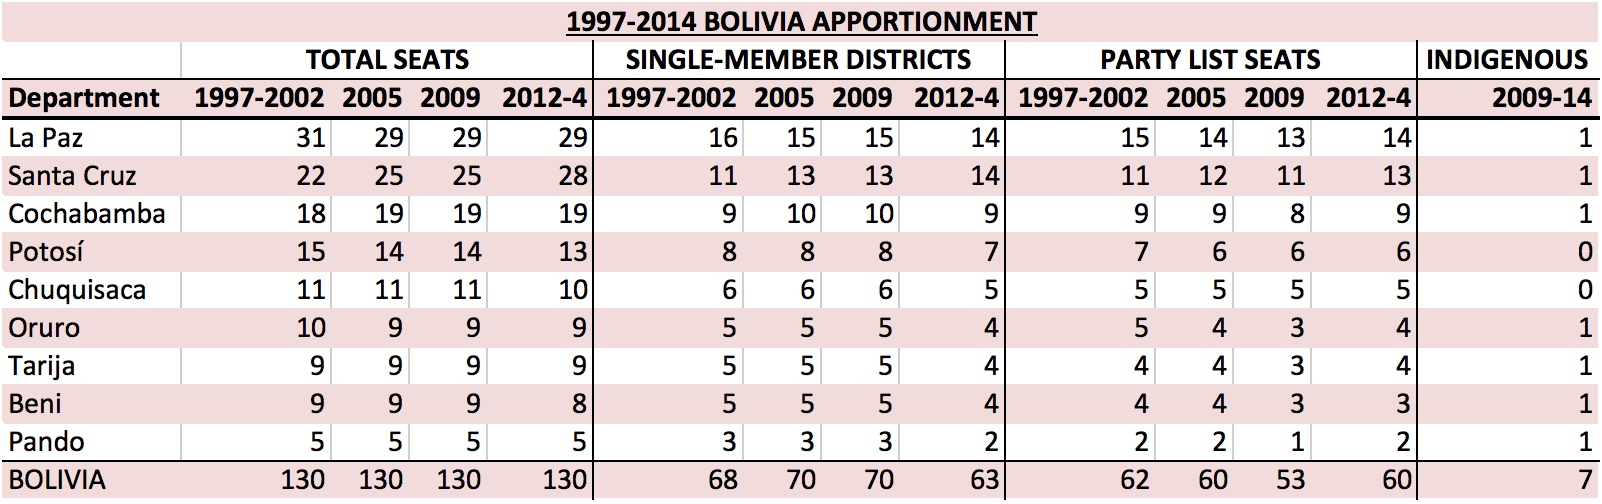 The 130 members are assigned to departments by the d’Hondt method based on population. However, the apportionment law provides protection for less populated departments and for departments that perform less well on the human development index (HDI).
The method of protection for less populated departments works as follows: (1) calculate the mean population of the 9 departments, (2) calculate the mean population of the departments with populations above the mean and the mean population of departments below the mean, (3) calculate the ratio of the mean for less populous to more populous departments, and (4) multiply the ratio by 130 to obtain the minimum number of seats guaranteed to the less populous departments.
The law does not make clear a similar formula for calculating the level of protection due to departments the have a lower score on the HDI. The division of seats within each department between SMDs, indigenous, and list seats is not enshrined in law.
Sources: Tribunal Supremo Electoral (TSE); Atlas of Electoral de Bolivia, Tomo 1 (La Paz: Tribunal Supremo Electoral, TSE 2010); Miguel Centellas, “Electoral Reform, Regional Cleavages, and Party System Stability in Bolivia,” Journal of Politics in Latin America 2: 115-31; Alexandra Alpert, Miguel Centellas and Matthew M. Singer, “The 2009 presidential and legislative elections in Bolivia,” Electoral Studies 29(2010), 757-61; Matthew M. Singer, “The presidential and parliamentary elections in Bolivia, December 2005,” Electoral Studies 26(2007), 200-205; Matthew M. Singer and Kevin M. Morrison, “The 2002 presidential and parliamentary elections in Bolivia,” Electoral Studies 23(2004), 172-82; personal communication, Miguel Centellas; Ley No. 421 (7 October 2013).